Workforce
With several colleges and trade schools in the mid-Maine region, there is an educated, highly skilled and dedicated workforce. Add to that the strong work ethic that the state is known for, and that makes FirstPark a great choice for your business. Workforce information is shown below.
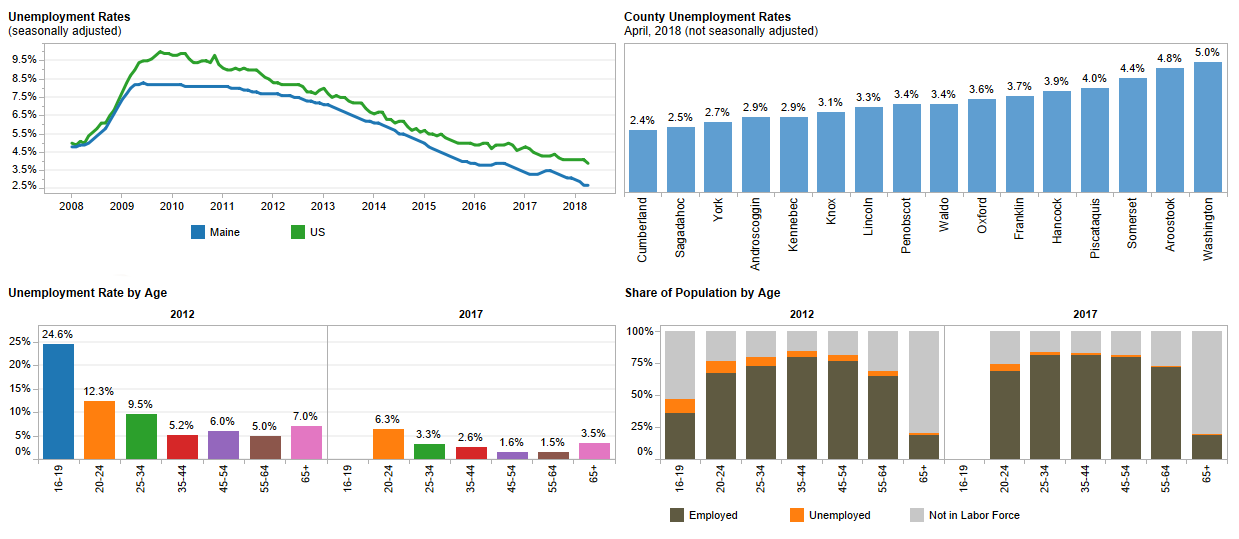
| Civilian Labor Force Estimates for Maine Counties, 2018 (not seasonally adjusted) | |||||
| Region | Component | JAN | FEB | MAR | APR |
| KENNEBEC COUNTY | Civilian Labor Force | 62,350 | 62,400 | 62,470 | 62,790 |
| Employed | 60,340 | 60,450 | 60,620 | 60,990 | |
| Unemployed | 2,010 | 1,960 | 1,850 | 1,800 | |
| Unemployment Rate | 3.2% | 3.1% | 3.0% | 2.9% | |
| SOMERSET COUNTY | Civilian Labor Force | 22,930 | 23,200 | 23,160 | 23,150 |
| Employed | 21,800 | 22,080 | 22,130 | 22,120 | |
| Unemployed | 1,130 | 1,120 | 1,040 | 1,030 | |
| Unemployment Rate | 4.9% | 4.8% | 4.5% | 4.4% | |
| This data is developed by the Maine Department of Labor, Center for Workforce Research & Information in cooperation with the U.S. Bureau of Labor Statistics. The employed and unemployed estimates may not add to the civilian labor force total due to rounding. (www.maine.gov/labor/cwri/laus.html) | |||||
Information on Maine’s Workforce from the Center for Workforce Research and Information
| Educational Attainment by Level |
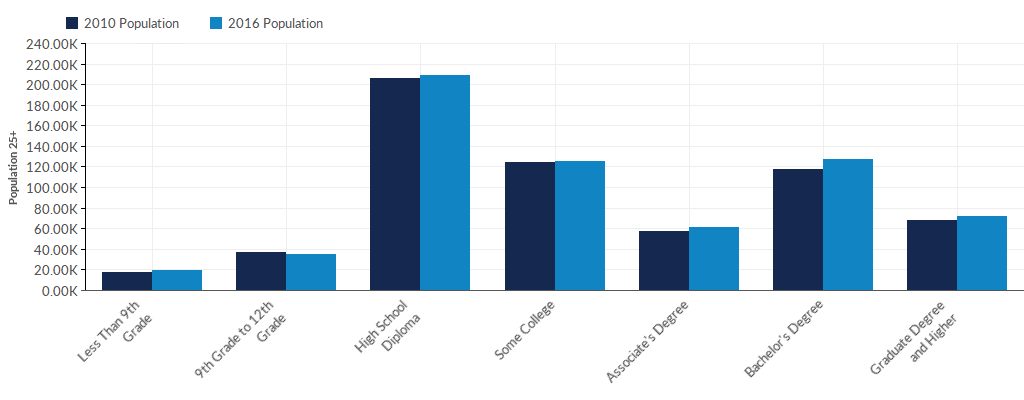
| Education Level | 2016 Population | % of Population | State % Population | National % Population | |
| Less Than 9th Grade | 19,295 | 3% | 3% | 6% | |
| 9th Grade to 12th Grade | 35,310 | 6% | 6% | 8% | |
| High School Diploma | 208,516 | 33% | 34% | 28% | |
| Some College | 125,402 | 20% | 20% | 21% | |
| Associate’s Degree | 60,830 | 9% | 9% | 8% | |
| Bachelor’s Degree | 127,602 | 19% | 18% | 18% | |
| Graduate Degree and Higher | 72,023 | 11% | 10% | 11% | |
| TOTAL: | 648,978 | 100% | 100% | 100% |